How to Display the Temperature Properly
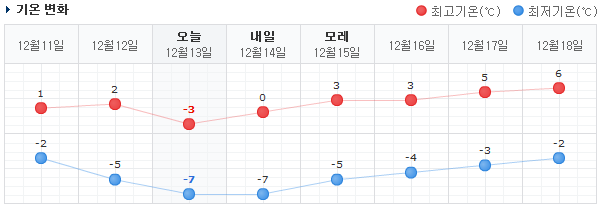
Naver has one of the best graphical temperature visualizations. Simple, clean, with the right amount of information. You can probably figure it out even if you can't read Korean or don't use Celsius. Web sites in Korea are usually usability disasters, but every so often I come across a true UX gem. Take Naver's visualization of temperature over time , f or example. I've seen many other temperature graphs, but Naver adds one tiny feature that makes theirs immensely more usable: the temperature from yesterday and the day before. That extra little bit of historical information makes the current temperature and forecast temperature much easier to read.